- Which channels bring buyers who come back?
- What should we reorder, and when?
- Where do shoppers drop out of checkout?
- Which products sell best together?
Usually connectedShopify · Stripe · Google Analytics · Ad platforms
Data analytics and BI services
Data analytics for startups and enterprises: we connect your tools into one source you can trust, then build the dashboards and forecasts your team acts on.
The forecast points to one clear next step.
MoonDive’s Data Analytics Services convert raw data into actionable business intelligence through end-to-end analytics, visualization, and predictive modeling. We design scalable data pipelines, interactive dashboards, and AI-powered forecasting to support faster, evidence-based decisions across product, operations, and executive teams. Services include data engineering, BI development, self-service analytics, and predictive insights tailored to business goals.
Pipelines bring every source together. Models are tested and documented, so each number has one definition.
Point at a source to trace where its data goes.
Live dashboards on the numbers you run the business by, refreshed on their own instead of rebuilt in spreadsheets every Monday.
Every project runs the same five steps. Watch what happens to a single customer along the way.
We start from the decisions you need to make, agree on the few metrics behind them, and map where that data lives today.
Pipelines pull from each tool on a schedule or in real time, so nobody exports a spreadsheet again.
Duplicates merge, formats line up and tests catch broken data before it reaches a dashboard.
We add the logic your team argues about today: segments, scores and forecasts, each with one definition.
The answer reaches the person who acts on it, in a dashboard, an alert or your product, and we train your team to use it.
Usually connectedShopify · Stripe · Google Analytics · Ad platforms
Usually connectedStripe · PostgreSQL · Salesforce · Core banking exports
Usually connectedClinical system exports · PostgreSQL · Google Sheets · Booking tools
Usually connectedSensors and IoT · ERP exports · MySQL · Kafka
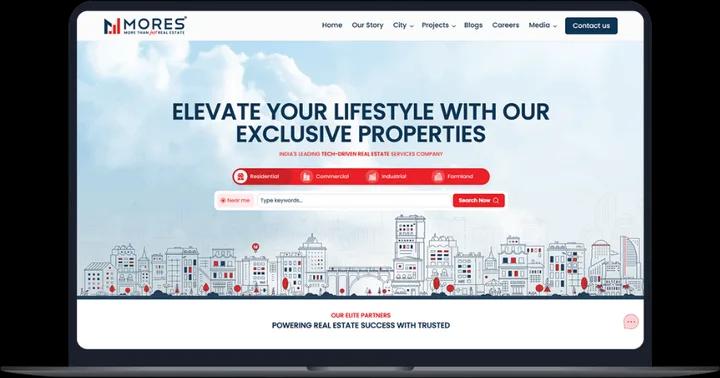
MoonDive is the name I would recommend to anyone seeking a committed custom application development company. Our relationships covered multiple areas such as software development of server-based systems with desktop and mobile apps, software testing, software consulting and integration. I really want to appreciate MoonDive team for work done in less time and effectively.
 Mohit MittalCo-founder & CEO, Moresmores.in
 Read the case study
Data Analytics, Business Intelligence (BI), and Data Science each play a unique role in how businesses understand and use data. Data Analytics focuses on examining data to answer specific business questions through statistical analysis, reports, and dashboards. Its goal is to explain what happened and why, using tools like Excel, SQL, Tableau, and Power BI. Typical timelines range from a few hours to a few days. Business Intelligence (BI) is a broader discipline that includes data analytics along with data warehousing, ETL processes, and real-time reporting systems. BI helps organizations monitor performance and make informed decisions through historical and real-time insights. Common tools include Power BI, Tableau, Looker, and Qlik, with projects generally taking days to weeks. Data Science goes beyond analysis to apply machine learning, statistical modeling, and predictive algorithms that forecast future outcomes and optimize performance. It focuses on what will happen and how to improve it, using advanced tools like Python, R, and TensorFlow, typically requiring weeks to months for implementation. At MoonDive, most projects begin with BI dashboards for real-time visibility and operational insights, later evolving into predictive analytics and data science solutions as clients advance their data maturity.
The data you need depends on your analytics goals. For basic reporting, 3–6 months of transactional data (sales, orders, users, events) is enough. For customer analytics, collect demographics, behavior, purchase history, and marketing touchpoints with at least 1,000 customer records. For predictive analytics, aim for 12+ months of data with 10,000+ records and clear outcomes. Focus on data quality; it should be accurate, complete, consistent, and up to date. If you’re just starting, set up tracking tools like Google Analytics or Mixpanel to collect data, or use external datasets to fill gaps. At MoonDive, we’ve built powerful analytics systems with as little as 10,000 rows of data, proving you often have more than enough to begin.
At MoonDive, we use a flexible analytics tech stack tailored to your business needs. For Business Intelligence and Dashboards, we work with tools like Tableau, Power BI, Looker, Metabase, and Google Data Studio. For Data Warehousing, we rely on Snowflake, Google BigQuery, Amazon Redshift, and PostgreSQL for smaller datasets. Our Data Processing and ETL layer includes dbt, Airflow, Fivetran, and custom Python scripts for advanced transformations. For Product Analytics, we use Mixpanel, Amplitude, Google Analytics 4, and Segment to track user behavior and engagement. For Advanced Analytics, we leverage Python, SQL, R, and Jupyter Notebooks to perform deep data modeling and insights. Tool selection always depends on your tech stack, team skills, budget, and goals. We’re platform-agnostic; our focus is on recommending what fits your business best, not what’s most profitable for us.
At MoonDive, analytics implementation timelines depend on project scope. A basic dashboard (5–10 metrics, one data source) takes around 2–4 weeks, covering data connection, layout design, and stakeholder reviews. A medium BI system with multiple data sources and dashboards usually requires 8–12 weeks for warehouse setup, ETL pipelines, modeling, and training. For a fully advanced analytics platform, including data warehousing, automated reporting, and self-service analytics, the process takes 16–24 weeks. A typical 12-week project includes: • Discovery (1–2 weeks): Define goals, data sources, and KPIs. • Data Infrastructure (3–4 weeks): Build warehouse and ETL pipelines. • Dashboard Development (4–5 weeks): Create and refine visualizations. • Training & Launch (1–2 weeks): Conduct user training and documentation. We also follow a quick-win approach, often delivering a core dashboard within 2–3 weeks to start driving insights early, like one client who saw their first revenue dashboard by week three.
Yes, MoonDive specializes in integrating data from multiple sources to create a unified analytics ecosystem. We connect databases (PostgreSQL, MySQL, MongoDB), SaaS tools (Salesforce, HubSpot, Stripe, Shopify), marketing platforms (Google Ads, Facebook Ads, Mailchimp), cloud storage (AWS S3, Google Cloud, Azure), and even custom APIs. Our integration methods include: • Pre-built connectors (Fivetran, Stitch) for quick, low maintenance syncing from 100+ sources. • Custom ETL pipelines (Python, dbt) for complex or unique data transformations. • Reverse ETL to push analytics data back into tools like Salesforce or HubSpot. We handle both batch syncing (every few hours) and real-time streaming for live dashboards. The result is a single source of truth, enabling cross-channel insights and accurate performance tracking. For example, an eCommerce client unified data from Shopify, Google Analytics, Klaviyo, and Facebook Ads, resulting in a 35% increase in marketing ROI through better attribution and decision-making.
The right KPIs and metrics depend on your business model and goals: • E-commerce: Revenue, Average Order Value (AOV), Conversion Rate, Customer Acquisition Cost (CAC), Lifetime Value (LTV), Cart Abandonment Rate, and Return Rate. • SaaS: Monthly Recurring Revenue (MRR), Churn Rate, CAC, LTV/CAC Ratio, Activation Rate, Net Revenue Retention, and Free-to-Paid Conversion. • Marketplace: Gross Merchandise Value (GMV), Take Rate, Active Buyers/Sellers, Liquidity, and Repeat Purchase Rate. • Content/Media: Daily/Monthly Active Users (DAU/MAU), Engagement Rate, Time on Site, Content Consumption, and Ad Revenue per User. • General Business: Revenue Growth, Profit Margins, Retention, NPS, Sales Pipeline Value, and Burn Rate (for startups). At MoonDive, we focus on actionable metrics that drive decisions, not vanity stats. We help you define KPIs aligned with your goals, build dashboards to monitor them, and set up alerts for performance deviations. Most clients start with 5–7 key metrics and expand as insights grow.
We maintain data quality and accuracy through a robust multi-step framework: • Validation at Ingestion: We check schema consistency, enforce correct data types, validate value ranges, and remove duplicates before storage. • Ongoing Monitoring: Automated checks run daily to track freshness, detect anomalies, and monitor missing or null data trends. • Transformation Best Practices: All pipelines are version-controlled, idempotent, and fully logged. We test sample data before production and reconcile totals between source systems and dashboards. • Documentation & Lineage: Every dataset includes a detailed data dictionary, transformation lineage, and known issues log for transparency. • Error Handling: Automatic retries, graceful recovery, and real-time alerts ensure continuity even when a source fails. At MoonDive, our systems deliver 99.5% data accuracy, and any discrepancies are resolved within 24 hours. Each dashboard also displays data freshness indicators, so users always know how recent their insights are.
Yes, MoonDive ensures strong data governance and compliance through structured ownership, role-based access, centralized data catalogs, and strict retention policies. We comply with major regulations like GDPR, CCPA, HIPAA, SOC 2, and PCI-DSS, using AES-256 and TLS encryption, row-level security, audit logs, and regular security reviews. To protect privacy, we apply anonymization, pseudonymization, and data masking in non-production systems. Our teams maintain thorough compliance documentation and receive regular training on secure data practices. Example: For a healthcare client, MoonDive built a HIPAA-compliant data warehouse with encrypted access, detailed audit trails, and routine compliance audits, passing certification with zero findings.
A data warehouse is a centralized system that combines data from multiple sources for fast analytics and historical tracking without affecting your main database. Operational DB: Handles live transactions. Data Warehouse: Handles analytics and large-scale insights. You need one if you: • Use multiple data sources. • Need historical or complex analysis. • Have a data team or plan for ML. At MoonDive, our solutions deliver ROI in 6–8 months through better, faster decisions.
Both serve different goals: • Batch Processing (most common): Data updates every 1–24 hours. It’s cost-effective, simple, and ideal for financial reports, dashboards, and trend analysis. • Real-Time Processing: Data updates within seconds. It enables instant insights for fraud detection, live monitoring, and personalization, but is costlier and more complex. • Near-Real-Time (Hybrid): Syncs every 5–15 minutes, offering a balance of cost and data freshness for product or social analytics. At MoonDive, we typically start clients with batch systems for reliability and scale, then add real-time components only where speed drives real business value.
Yes! MoonDive offers tailored data analytics training to help teams become data-driven: • BI Tool Training (Tableau, Power BI, Looker): Dashboard navigation, report creation, and collaboration. (4–8 hours) • SQL Training: Query writing, joins, aggregations, and performance tips. (12–16 hours, hands-on labs) • Data Literacy Workshops: Reading dashboards, understanding KPIs, and making data-driven decisions. (4 hours) • Advanced Analytics (Python/R): Statistical analysis, visualization, and best practices. (20–40 hours) Live workshops, recorded sessions, detailed documentation, and ongoing office hours. Our programs enable self-service analytics, reducing ad-hoc report requests by up to 60%. Every BI implementation includes training to ensure your team confidently explores and utilizes data.
MoonDive offers end-to-end analytics support to keep your systems accurate, scalable, and insightful. Our Managed Analytics Service covers dashboard updates, data pipeline monitoring, performance tuning, and user assistance. Support plans: • Basic: Monthly updates, monitoring, and bug fixes. • Standard: Priority support, weekly updates, and monthly insights. • Premium: Dedicated engineer, daily support, and ad-hoc analysis. We also provide proactive insights, anomaly alerts, quarterly optimizations, and self-service resources like guides, tutorials, and team channels. As your business grows, we scale your analytics from core dashboards to predictive and ML-driven insights, ensuring long-term value and continuous improvement.
Book a free call with the people who would build it. Tell us the decision you want to make, and we will map the data, tools and steps it takes.
Talk directly to the people making the decisions.
Agreed in writing at the end of discovery, before any production code.
Two-week sprints, each ending with working software, never a black box.
We stay accountable after the product goes live.
We use cookies to measure how our site is used and improve it, and a service that can identify the company or person visiting.
You’re in control of your preferences, and these tools only activate when you allow them. Read our Privacy Policy.